


Pump curve vs system curve checks show where a PCB chemical pump will actually run, not just what the pump can do in a catalog. The real operating point is the place where the pump curve intersects the resistance of the installed line. In a PCB wet process loop, that resistance changes often. Filters load, nozzles clog, valves throttle, and pipe runs collect residue.
This matters because a pump can be correctly labeled yet still deliver poor etching, plating, cleaning, or filtration performance. If the operating point shifts too far left, flow may fall and the line may lose exchange rate. If it shifts too far right, the pump may run with low head margin. Noise, vibration, and suction-side risk can increase. This article builds on the earlier QEEHUA guide to total dynamic head for PCB chemical pumps. Here, the focus is how that head changes after installation.
What the Real Operating Point Means
A pump curve describes pump head at different flow rates. A system curve describes required head at those same flow rates. It includes piping, tank level, filter, valves, fittings, and the spray section. The actual flow is not chosen by the pump alone. It appears where those two curves meet.
The Hydraulic Institute system curve reference explains that total system head combines static head and frictional head. It also shows that the operating point depends on where the pump curve and system curve meet. For PCB and electroplating plants, the same pump can behave differently after filter loading. It can also change after a maintenance team resets valve positions.
System head = static lift + filter differential head + pipe/fitting loss + spray/nozzle lossHead from pressure = 10.2 x pressure in bar / specific gravityTarget pump flow for filter loop = filter rated flow x 1.1 to 1.2
Those formulas are practical enough for a first check. They do not replace a detailed design calculation, but they show why one catalog point is not enough. A pump running clean water through a short test line sees one curve. A pump pushing warm etchant through long PVDF piping, a loaded cartridge filter, a check valve, and a spray header sees another.

Why PCB Wet Lines Move Off the Curve
PCB wet process lines rarely stay at the design condition. Filter cartridges collect copper particles, solder mask residue, carbon fines, crystallized salts, or sludge. Spray nozzles can narrow. A bypass valve can leak internally. A bottom valve screen can load with debris. Each change raises or lowers the system curve.
QEEHUA local maintenance records also show a common sizing mistake: pump flow and filter flow do not match. A useful starting rule is to keep pump flow close to 1.1 to 1.2 times the filter rated flow. Then use a discharge regulating valve to protect the cartridge and housing. If the pump greatly exceeds the filter capacity, pressure rises. The result can be cartridge deformation, filter bypass, or frequent replacement.
When the filter is the limiting component, the problem may look like pump weakness even when the pump is healthy. The stronger clue is pressure. If discharge pressure rises while return flow falls, the operating point has moved left on the pump curve. The earlier QEEHUA article on electroplating filter pressure that is too high covers this pressure-side symptom in more detail.

Four common curve-shift scenarios
These scenarios also explain why one plant may report unstable flow while another plant using the same pump model runs normally. The installed system sets the final operating point. The pump model only defines one side of the intersection.
A Field Check for Pump Curve vs System Curve
Use this check when a PCB line has weak spray pressure, poor bath exchange, fast filter clogging, or unexplained pump noise. Start with the process condition, not the motor label.
First, record tank level, liquid temperature, and specific gravity. Then record filter pressure, suction condition, valve position, and measured flow if a flow meter is available. Then compare the measured flow and head with the pump curve. The Pumps & Systems pump sizing guide gives a practical overview of pump sizing. It explains why flow rate and total head must be known before selection.
| Field reading | What it says about the curve | Practical action |
|---|---|---|
| Filter differential pressure reaches 0.2-0.3 MPa | The filter is adding major resistance. The system curve has moved upward. | Replace or clean the cartridge. Check whether a pre-filter is needed. |
| Flow drops while discharge pressure rises | The pump has moved left on the curve because the line is restricted. | Check cartridge loading, closed valves, nozzle blockage, and pipe deposits. |
| Flow drops while discharge pressure also falls | The pump may be starved or losing suction condition. | Check tank level, inlet screen, suction pipe size, air pocket, and NPSH margin. |
| High flow but poor filtration quality | The pump may exceed filter media capacity, or liquid may bypass the media. | Match pump flow to filter rated flow and inspect center rod, O-ring, and bypass valves. |
| Required turnover is 2-4 tank volumes per hour | The target flow starts from process exchange, not from a random pump size. | Calculate tank volume, target turnover, filter capacity, and pump head together. |
If the flow loss appears on the suction side, do not keep throttling the outlet to force stability. Suction problems need suction corrections. The QEEHUA guide to NPSH margin for PCB chemical pumps explains suction-side risk. Low inlet pressure, high temperature, and blocked suction screens can make a pump noisy even when the pump curve looks adequate.
What to Record Before Selecting a Pump
A useful RFQ for a PCB chemical pump should describe the system, not only the desired flow. Without that data, the supplier has to guess the system curve. That is where many mis-selections start.
Ask the process or maintenance team for these records before selecting or replacing a pump:
- Required process flow or tank turnover rate.
- Tank volume and minimum liquid level.
- Static height difference between tank liquid level and return point.
- Pipe material, pipe inside diameter, approximate length, elbows, valves, and check valves.
- Filter type, cartridge precision, clean pressure, dirty pressure, and rated flow.
- Liquid name, concentration, temperature, specific gravity, solids, and crystallization risk.
- Available motor power, voltage, frequency, and control method.
For fine-line PCB work, the consequence is not only pump efficiency. Low circulation can leave residual copper, residual film, uneven line width, pinholes, or poor hole metallization. Too much flow through the wrong filter can rupture or bypass the media and send particles back into the bath.
Where QEEHUA Pumps Fit
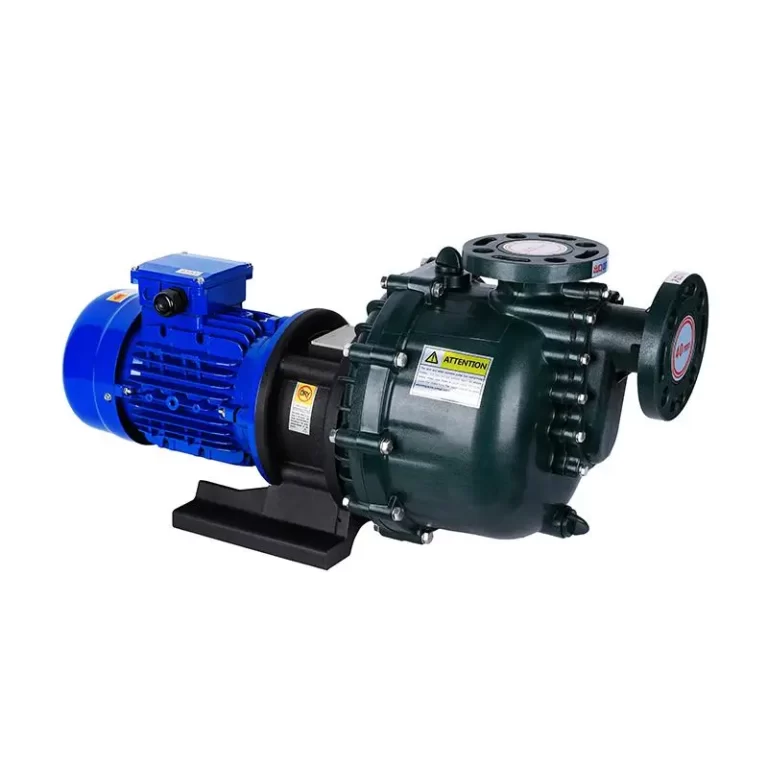
QEEHUA typically starts pump selection by matching liquid chemistry, leakage requirement, flow, head, suction condition, and filter capacity. For corrosive PCB and electroplating loops, sealless magnetic pumps can reduce leakage points. Centrifugal or vertical pumps may fit transfer, circulation, sump, or spray-line duties depending on the layout.
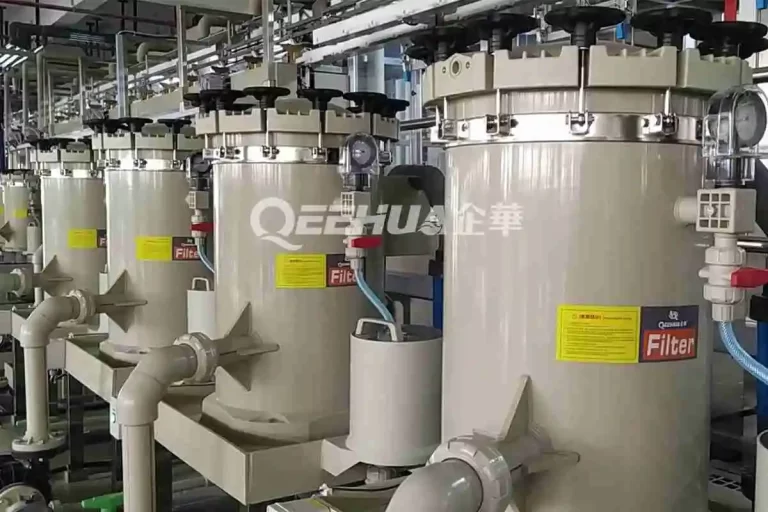
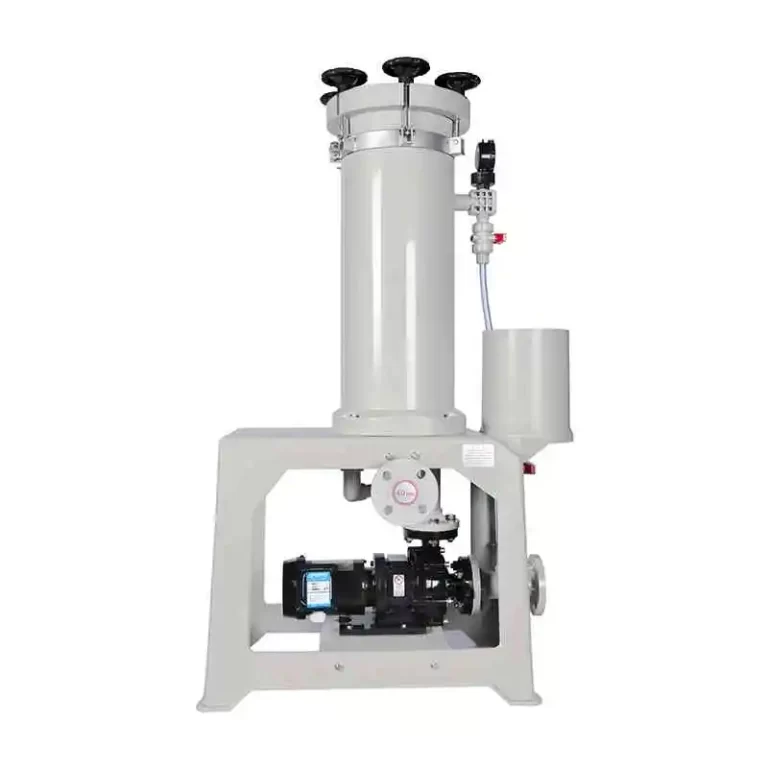
If the loop needs corrosion-resistant leak control, review QEEHUA’s magnetic pump products. If the main issue is filtration quality, compare the pump curve with filter rated flow. Also review the QEEHUA guide to PCB wet process filtration and chemical filter pump selection. The pump and filter should be specified as a working system, not as two isolated components.
FAQ
Why does a PCB pump deliver less flow than the catalog curve?
The catalog curve does not include the full installed resistance. Loaded filters, small pipes, elbows, valves, check valves, and spray nozzles can reduce flow. Liquid level changes can also move the operating point.
How do I know if the filter or the pump is causing low flow?
Compare pressure and flow together. Rising discharge or filter pressure with falling flow usually points to restriction. Falling pressure and falling flow often points to suction starvation, air entry, low level, or pump wear.
Should pump flow be higher than chemical filter rated flow?
A practical starting point is pump flow near 1.1 to 1.2 times the filter rated flow, with outlet regulation as needed. A much larger pump can overload cartridges and increase bypass or rupture risk.
What data should an OEM send before asking for a PCB chemical pump curve?
Send target flow, total head estimate, tank level, and pipe size. Also send pipe length, filter pressure, chemical, temperature, specific gravity, solids, and voltage. This lets the supplier compare the pump curve with the expected system curve.
Can a variable frequency drive fix a bad pump operating point?
A VFD can tune speed, reduce startup shock, and help control flow. It cannot fix blocked filters, poor suction layout, undersized piping, or a pump selected far outside the required head and flow range.